Data Management and Reporting Benefits
Data Management refers to a comprehensive process of acquiring, validating, storing, protecting, processing, and reporting on data that comes from various different sources in an enterprise. It is now widely accepted that data is the new oil. But oil needs to be mined in order to be more valuable.
The four stages of data management:
- Data lifecycle
- Data generation
- Action
- Understanding the different operations that make up data management
Although we briefly discuss these different stages in this blog, the focus is on reporting, which is crucial. Admins need the ability to generate custom reports that are tailor made for data management operations. This way they can take timely action and keep the lights on!
There is no one size fits all for reporting. Requirements depend on the intent and the actions that can be derived from a report. Enterprises should be proactive in understanding data and trends in order to plan their operations better and to avoid surprises or downtime, missed SLAs, and customer satisfaction issues.
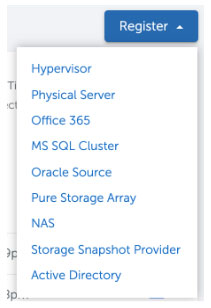
A comprehensive data management platform also makes it simple to ingest data from a multitude of sources whether they are in the cloud, reside in SaaS applications, or on-prem servers.
Data that is ingested should be verified for its integrity and indexed to be retrieved easily when needed. Data should also be stored efficiently. Global deduplication and compression techniques get rid of redundancy and store vast amounts of data in the least physical footprint. Data should be backed up from the vast array of sources as per Recovery Point Objective (RPO) and Recovery Time Objective (RTO) policies that give the user full control over the data. These capabilities are crucial for most use cases where any stored data element, such as a VM backup or an Office 365 mailbox, needs to be retrieved instantly in the face of a disaster or a ransomware attack. Data stored should be available for an analytics engine and it should be possible to visualize the data, whether it is stored in a SmartFile view or within AWS Glacier.
Understanding Data Insights
Now that we have covered the breadth of what goes into data management operations, from ingest to recovery, what are some of the questions or insights administrators might be trying to glean from the data management process?
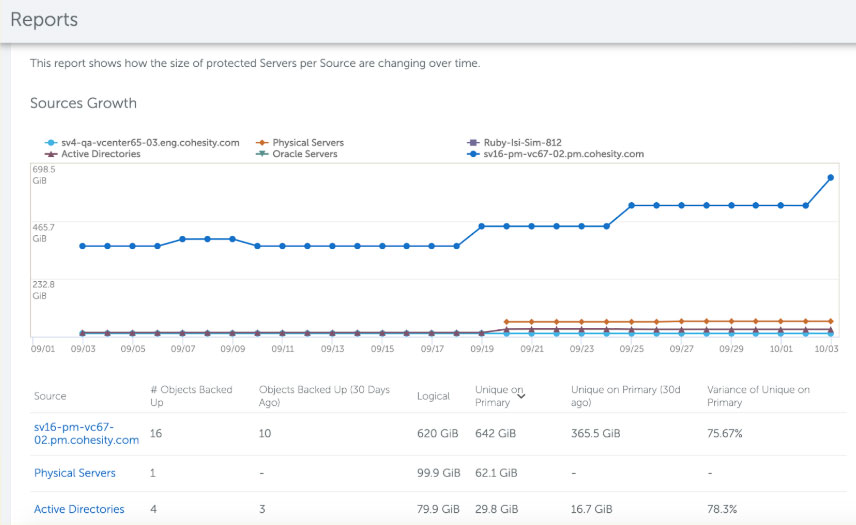
Let us start from the ingest process. Once the sources to ingest data from are setup, the administrator wants to monitor how these sources are faring in terms of data ingested. How far away are they from the mean, and should there be any adjustments made to the plan if, say, one source sends much more data than expected? In other situations, a massive variance from the norm might indicate a security threat or anomalous behavior that the report might surface.
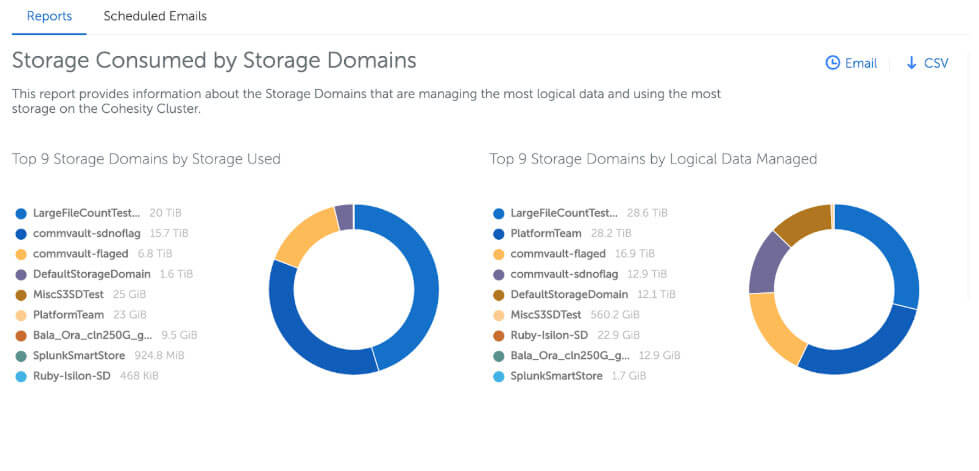
Data Management: Monitoring Capacity
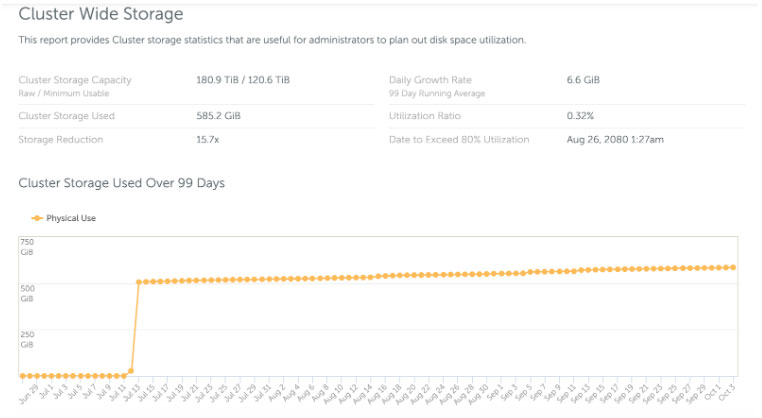
Once the data is in, one very obvious category of operations is to monitor capacity usage. Which types of files are consuming the most space? What percentage of my total capacity do I have left? How much data am I consuming on AWS S3 or Glacier?
These questions arise everyday and there is almost an anxiety on the mind of the storage admin that they should not be caught by surprise. Getting a summary report emailed gives them a peace of mind.
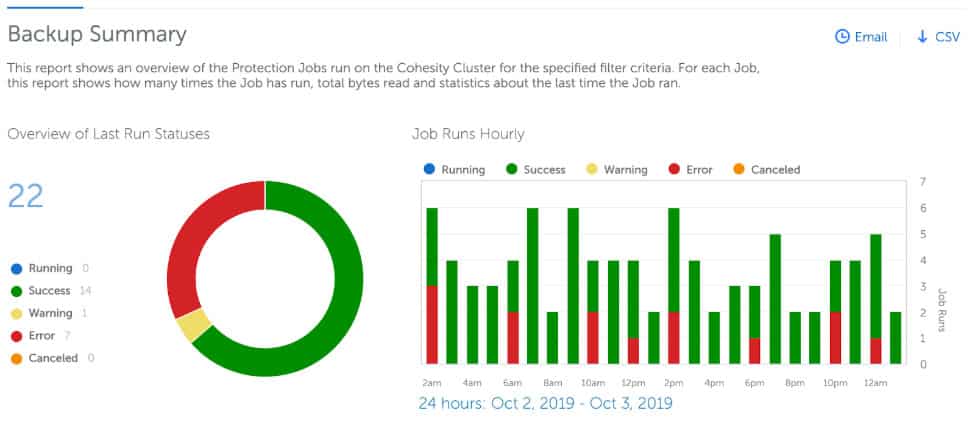
Data Protection Reports Provide Status on Protected VMs
- How many VMs were backed up,?
- Which VMs were successful?
- What percentage of protection groups failed SLA?
- What were the failures in the last 24 hours?
- Which sources reported most failures?
Data Management platforms need to lend such insights readily, programmatically, or on demand.
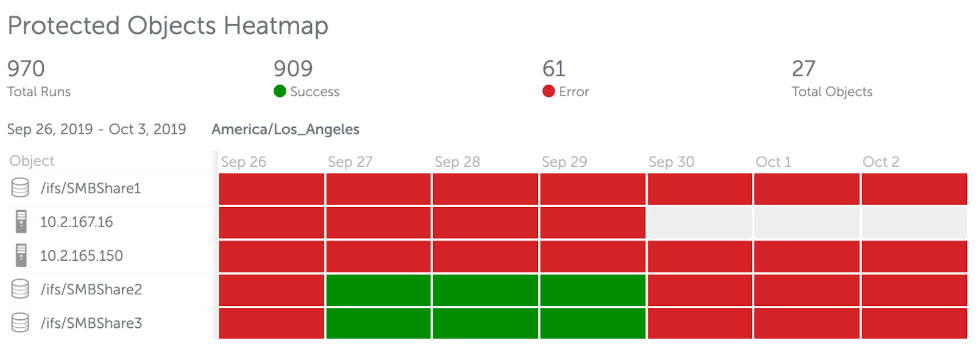
Data Protection metrics should be available at not just a protection run or group level, but down to the object. For each object it is critical to understand the trends of failures in protection so that operators can take proactive measures if there is a repeated pattern on those failures. A heatmap view gives an instant pulse on object-level backup failures. A report that gives new insight and enough information to dig deeper makes it actionable. In this report below, the SMBShare1 is clearly out of service for the past week. Is that intended?
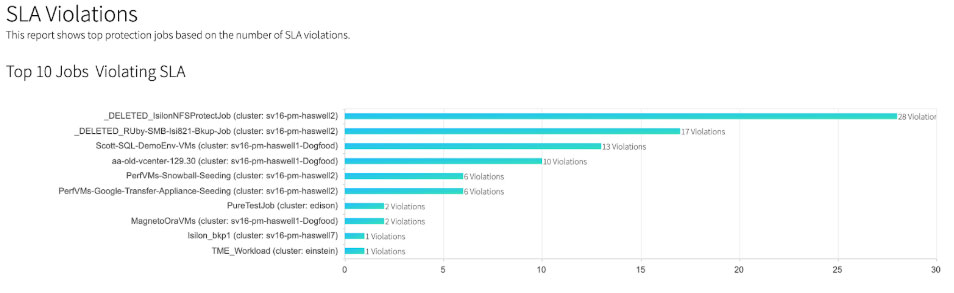
Some enterprise user personas go beyond a single location, type of source, or infrastructure element. They are responsible for global SLAs to their end customers. In such cases, they want an aggregated report across all their infrastructure elements. For my global deployment, I wish to find out the SLA across all protected objects violated SLA. The Multi-cluster SLA violation report offers this view.
As we can see from some of the above use cases, a portfolio of comprehensive built-in reports is useful. These reports can be customized to the level of granularity, type of objects, and duration over which a report is generated. Offering flexible ways to export, automate, and generate reports arms an enterprise with evidence to proactively resolve issues before they arise. It also allows them to run a transparent, no-surprises operations.
Reporting is key to efficient data management and mining for that metaphorical value – or oil – in the data. Cohesity offers a rich set of built in and custom reports to help run your data management operations the way you know best with the information we put in your fingertips.