IT is the invisible powerhouse behind the success of any modern business. Shouldering the responsibilities of ever-increasing business agility demands, compressed SLAs, and always-on availability, IT teams are hard at work to make enterprises more nimble and responsive.
However, this rapid efficiency has often come at a cost — and it is particularly pronounced in data management. The pressure of squeezed release-cycles combined with fast-changing application architectures has, in many cases, left a trail of data silos, security failures, non-compliance, and ballooning cloud bills.
As an IT leader, the first step to getting your house in order is to get visibility into all your data infrastructure and operations. With today’s announcement of the Reporting app on the Cohesity Marketplace, we’re helping our customers do just that.
Cohesity’s Reporting Capabilities
With the strong belief that IT design decisions should be data-driven, Cohesity Helios has always been feature-rich when it comes to reporting. The platform is natively capable of generating over 20 different reports on a variety of data center health vectors such as data capacity, SLA performance, backup status, and much more. It’s available on demand or on-schedule, not only as beautiful visualizations, but also through its REST API. For our service provider partners, the platform even offers tenant-level chargeback and reporting capabilities.

But while built-in reports are great to have, our customers have often asked us for the ability to generate custom reports catering to a variety of personas:
- The finance controller who needs to identify transaction volumes from three years back
- The IT Director who wants a monthly PDF summary of critical events and failures
- The CIO who wants to evaluate QoQ operational efficiency gain through a simple chart
The All-New Cohesity Reporting App
Strong business outcomes are powered by strong business intelligence. This is the primary motivation behind the Reporting app. The app is a rich, web-based designer (based on the popular analytics app JReport) that leverages the Cohesity reporting database to generate custom reports in a variety of easily consumable formats. Think SLA-performance vs number of organizations onboarded, in a simple line chart on a PDF, scheduled to arrive in your inbox every first Monday of the month.
The Flexibility to Simply Run Reports, but Also the Power to Create Them
The app was built keeping in mind both the power-user, and the low-touch user. We have found that data center admins, business continuity engineers, sec-ops, and SREs fall in the builder category, and IT execs and app owners in the consumer.
Although you can get fairly sophisticated reports with the app, you do not need to be SQL-savvy to use it. We’ve managed to abstract away the underlying database schema by building dedicated reporting middleware called “Business Views” – use-case-specific metadata collections that simplify report runs.
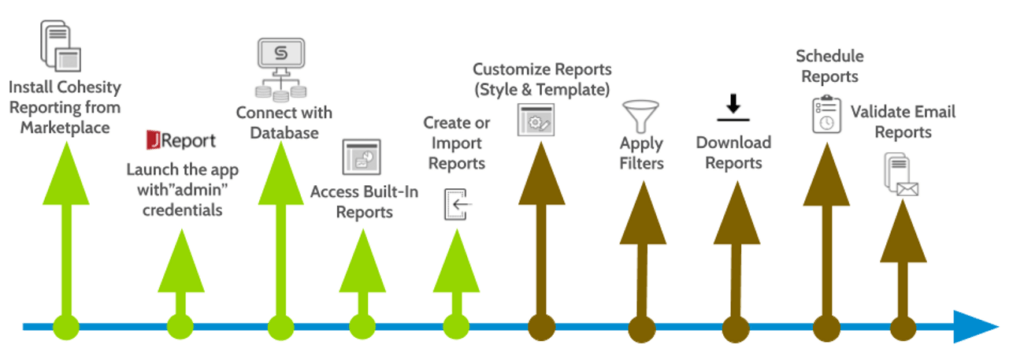
Regardless of the user-profile, the app can be launched straight from Helios. It’s straightforward to build a report. Simply select a Business View (for example, Protection Summary), add the attributes relevant to your report (such as source object types, recovery status, and recovery success metrics), and create or select the logical formulae that tie your attributes into your desired visual format. Once the template has been published, anyone in your company with access to the app can use it to generate a report.
The idea is to not only create a smooth flow of data infrastructure stats across organizations, but also build a pipeline for remediation in case of exceptions, such as backup failures, compliance findings, or SLA risks.
A full user-guide, complete with how-to’s for common scenarios, is available here. It should be noted that the purview of each report is a single cluster (which, given Cohesity’s infinite scalability, can span a very large data environment).
Download the App
At Cohesity, our mission is to help our customers tackle mass data fragmentation. With Cohesity Reporting, we’re building on an already strong reporting and analytics framework that helps you manage, secure, and make sense of your data. The Reporting app is in tech preview, and we’d love to have your feedback. Get the app here.